 Infographics work in the classroom because they grab students and allow an entry point to learning — and because they sum up pages and pages, even chapters, of information that would take a reader hours to process. Interactive infographics make kids want to immediately start clicking around to see what’s what. For a teacher who prioritizes an inquiry-driven classroom, that’s a great starting point. Infographics and Data visualization are not just for consumption though, teachers and students can also challenge the learning process by creating original graphics for themselves.
Go here –> http://www.nytimes.com/interactive/2012/12/30/multimedia/2012-the-year-in-graphics.html
Consumption:
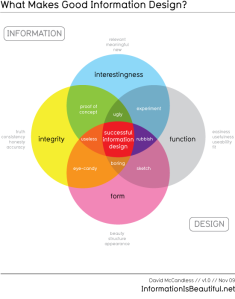
Consuming the information is one portion of the equation when discussing data visualization. Sometimes you look at a piece and think, what the heck is that supposed to be telling me!  There are elements of design to evaluate as well as functionality/clarity of purpose. Suggestions for places to go to begin consuming infographics and data visualization –
- Information is Beautiful
- Data Visualization
- Flowing Data
- Excel Charts Blog – Data Visualization
- GOOD Infographics
- Daily Infographic
- Infographic-a-day
… classroom examples of consumption graphics
- Real Estate Prices
- History of the Two Party Vote
- Gettysburg Address
- WorldMapper: The world as you’ve never seen it before
- Handsome Atlas
- Income Inequality as seen from space
 Places for Interactive Consumption: The previous list of sites takes you into the world of investigation of blogs and discussion of topics that are static (pretty much). There is a hybridized space between consumption and production where the individual interacts and manipulates the data. This is often where one can lose a day or two to mucking around. At least that is what happened to me when I first came across Gapminder. Dang. Here are some more examples of sites that not only visualize, but allow manipulation as well.
- New York Times Interactive
- Gapminder
- OECD Regional Explorer
- Working in America
- Stat World – World Data
… classroom examples of interactive consumption graphics
Evaluation/Creation: Looking at data visualizations and infographics are fun. Creating them is difficult. I suggest a healthy bit of evaluation of a variety of infographics before attempting to make them. There is often a sense of ‘where do I start’
- L10 Tips for Designing Infographics
- Themes for a good infographics
- Periodic Table of Visualization Methods
- EDWARD R. TUFTE; Campaigning For the Charts That Teach
- ChartChooser
- How to Create an Effective Infographic
Tools for creation…
- Infogr.am
- Easelly
- Venngage
- Chart Tool
- Google Apps
- LucidChart
- ManyEyes
- Tableau (PC only) 😦
- Createagraph
- Chartle
- ChartGizmo
Data to play with…
- 2008 Voter Turnout – screencast of how I used the data
- State of the Union Data
- South Carolina GOP Primary Exit Data
- 2010 Census Data
- OECD Data Sets
Storytelling tools – Digital

Great class at ITSC. I can envision using what I learned in my science courses. If students collect and analyze data they can share the info in a shared google document and then copy-paste into Many Eyes.
This will allow students to analyze others data as well as their own…
Often students don’t know that they are the outlier…
Thank you for providing this workshop. I was not aware of all of the tools available on the web. I am too busy to explore so this was very helpful.
Very nice work today D. Loved how you structured the workshop.